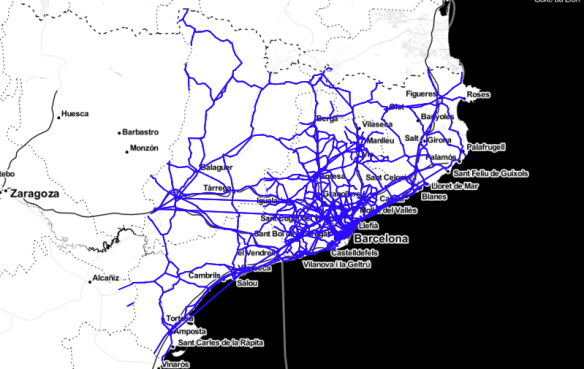
Recently I had another challenge, which I believe has the characteristics to be a common problem. I have a table with attributes, in CSV format, one of which is geospatial.
CSV is a structured format for storing tabular data (text and numbers), where each row corresponds to a record, and each field is separated by a known character(generally a comma). It is probably one of the most common formats to distribute that, probably because it is a standard output from relational databases.
Since people hand me data often in this format, and for a number of reasons it is more convenient for me to to use JSON data, I thought it would be handy to have a method to translating CSV into JSON, and this was the first milestone of this challenge.
The second milestone of this challenge, is that there is some geospatial information within this data, serialized in a non standard format, and I would like to convert it into a standard JSON format for spatial data; e.g.: GeoJSON. So the second milestone has actually two parts:
- parse a GeoJSON geometry from the CSV fields
- pack the geometry and the properties into GeoJSON field
To convert CSV (or XML) to JSON, I found this really nice website. It lets you upload a file, and save the results into another file,so I could transform this:
TMC,ROADNUMBER,DIR,PROV,CCAA,StartLatitude,StartLongitude,
EndLatitude,EndLongitude
E17+02412,A-2,E-90/AP-2/BARCELONA-ZARAGOZA (SOSES),LLEIDA,
CATALUNYA,41.5368273,0.4387071,
41.5388396,0.4638462
into this:
{
"TMC": "E17+02412",
"ROADNUMBER": "A-2",
"DIR": "E-90/AP-2/BARCELONA-ZARAGOZA (SOSES)",
"PROV": "LLEIDA",
"CCAA": "CATALUNYA",
"StartLatitude": "41.5368273",
"StartLongitude": "0.4387071",
"EndLatitude": "41.5388396",
"EndLongitude": "0.4638462"
}
This gave me a nicely formatted JSON output (the first milestone!), but as you can notice the geometry is not conform with any OGC standards. It is actually a linestring, which is defined by a start point (StartLongitude, StartLatitude) and an end point (EndLongitude, EndLatitude).
According to the JSON spec, a linestring is defined by an array of coordinates:
So the goal would be to transform the geometry above into:
"LineString",
"coordinates": [
[0.4387071, 41.5368273], [0.4638462, 41.5388396]
]
Once more, jq comes really handy to this task.
The JSON can be transformed into a feature using this syntax:
cat tramos.json | jq -c '[.[] | { type: "Feature", "geometry": {"type": "LineString","coordinates": [ [.StartLongitude, .StartLatitude| tonumber], [ .EndLongitude, .EndLatitude | tonumber] ] }, properties: {tmc: .TMC, roadnumber: .ROADNUMBER, dir: .DIR, prov: .PROV, ccaa: .CCAA}}]' > tramos.geojson
Since the JSON converser parse all the variables into strings, it is important to pass a filter (tonumber) to make sure that the coordinate numbers are converted back into numbers.
{
"properties": {
"ccaa": "CATALUNYA",
"prov": "LLEIDA",
"dir": "N-IIA/SOSES/TORRES DE SEGRE/ALCARRàS",
"roadnumber": "A-2",
"tmc": "E17+02413"
},
"geometry": {
"coordinates": [
[
0.4714937,
41.5420936
],
[
0.4891472,
41.5497014
]
],
"type": "LineString"
},
"type": "Feature"
}
Since we are creating an array of features (or “Feature Collection”), to be conform with GeoJSON, it is important to declare the root element too, by adding this outer element:
{ "type": "FeatureCollection","features": [ ]}
The result should be a valid GeoJSON, that you can view and manipulate in your favourite GIS (for instance QGIS!) 🙂


